When looking at DNA matches the various companies give you a general range of possible relations, close relative to first cousin, first cousin to great-nephew/niece, third to fifth cousins, etc. While this is somewhat helpful, it is also somewhat vague. Estimating the generational differences between matches and using tools from the Shared cM Project can significantly narrow the possible relationships of DNA matches.
A few weeks ago a "cousin" contacted me through one of the major DNA genealogical companies. She was a genetic match with my grandmother and wanted to determine their connection. After a few emails back and forth looking for a common ancestor about four or five generations back she told me her father, Tom (name has been changed), was adopted and she was actually working on finding his birth family. My grandma's connection with her father was too far back to be of much help with the information she currently had, but I offered to help with her search.
The closest genetic matches for Tom was a first cousin and a great-nephew, per the estimated relationships the DNA testing company suggested. At my request, she sent me the information so I could review it.
The first thing to do with a genetic match is determine the generational difference between the two matches. In this case, the possible first cousin and Tom were both in their 60s. The cousin did not have a family tree posted, so I was unable to look at the actual generations moving backward. While being approximately the same age puts them most likely in the same generation, it is not a certainty. For instance, my mother was born the same year as her aunt. However, for the time being my assumption is that first cousins is still a plausible relationship.
With the second match, the supposed great-nephew was in his 30s compared to Tom in his 60s. In this case I did have access to his parents' information and they were in their 50s. Most likely there is only one generation between Tom and this match, not the two generations that would be required for a great-nephew. The age difference would suggest this match is related to Tom by only one generation, meaning one of this person's parents is a possible sibling to Tom.
Looking at the generational difference is only the first step. Next, look at the number of centimorgans (cM) the matches have in common. Tom and his cousin have 1,164 cM in common. Take that information to The Shared cM Project, compiled by genetic genealogist Blaine Bettinger, accessed through the DNA Painter website. Input the amount of shared cM and you will receive a chart with the likelihood of certain relationships. This is what it looked like for Tom and his possible cousin match:
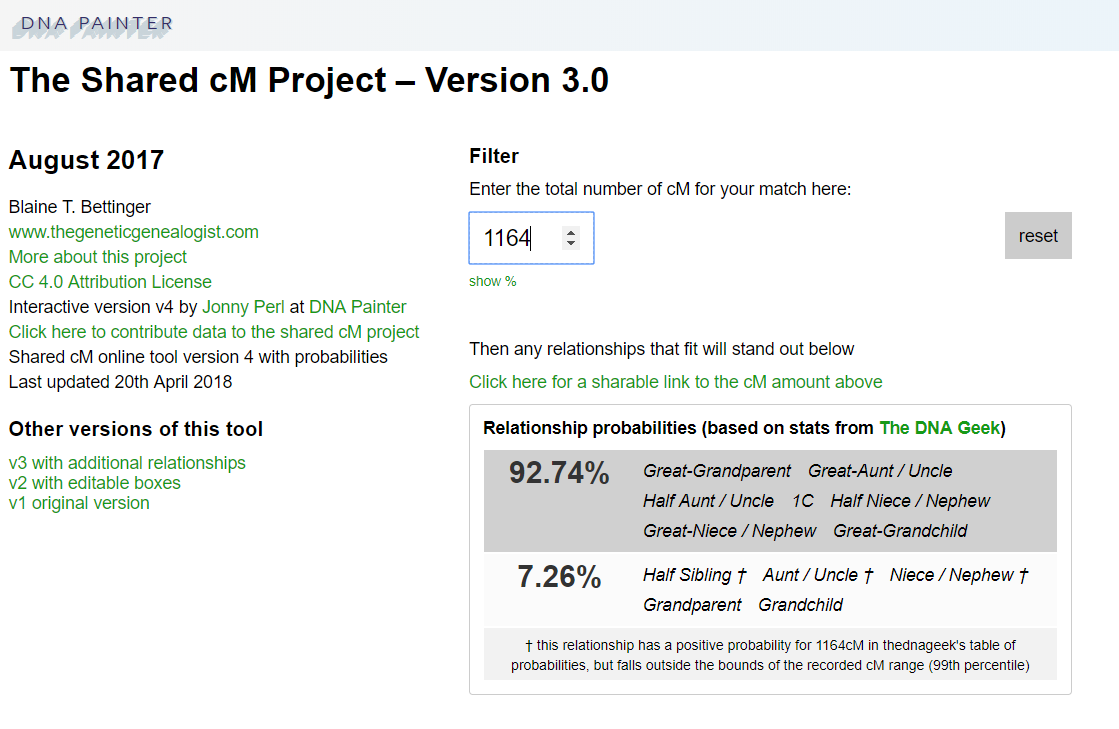 |
| dnapainter.com/tools/sharedcmv4 |
Now look at the second match's results:
 |
| dnapainter.com/tools/sharedcmv4 |
At first, the assumed match was a great-nephew with the information from the testing company. By looking at generational differences the assumed relationship changed to a nephew. Then, using the shared cM chart, the assumption changed to half-nephew. This is an excellent example of how estimated relationships can change as we analyze the data regarding a genetic match rather than accepting the DNA company's estimation.
These examples are of matches that share a large number of cM. In the examples above the amount of DNA shared resulted in a small list of possible relationships with greater than 90% probability. Amounts of DNA less than 400 cM result in more possible relationships with a lesser degree of probability. For instance, the chart may provide two groups of possible relationships with each group having a 40% probability. This process will still help identify relationships with smaller amounts of shared DNA, but it won't necessarily narrow the options as tightly as larger amounts of shared DNA.
These tips are a good place to start when determining relationships between matches, but assumptions at this point are made from statistical probabilities and are not relationships of fact. Further genealogical research and DNA testing are required to establish relationships with certainty. With the number of possible common ancestors doubling each generation, using these strategies and tools can help focus your search for DNA matches more effectively by helping you focus on possible generations of common ancestors.
No comments:
Post a Comment